Sunday, August 21, 2016

Hi everyone,
Lets take a look on weekly & daily chart of FCPO (future crude palm oil)

Weekly - 
CS pattern - long upper shadow -  potential pullback- bearish.
Trendline - Breakout of bearish trendline - bullish
Structure - yet to break last LH.- maintain bearish

Daily-
CS pattern - Harami at resistance - potential going lower.- Bearish
Trendline - Breakout of bearish trendline - Bullish
Structure - making HH. if break 2530, then 'Low' is established.
At the moment, price stops at 2580, with resistance at 2650-2680 area. 

My opinion, for price to further up, they need to break 2680 area. My guess, it will try to find footprint at minimum 38% fiboa area or deeper. who knows. Trade what we see OK.
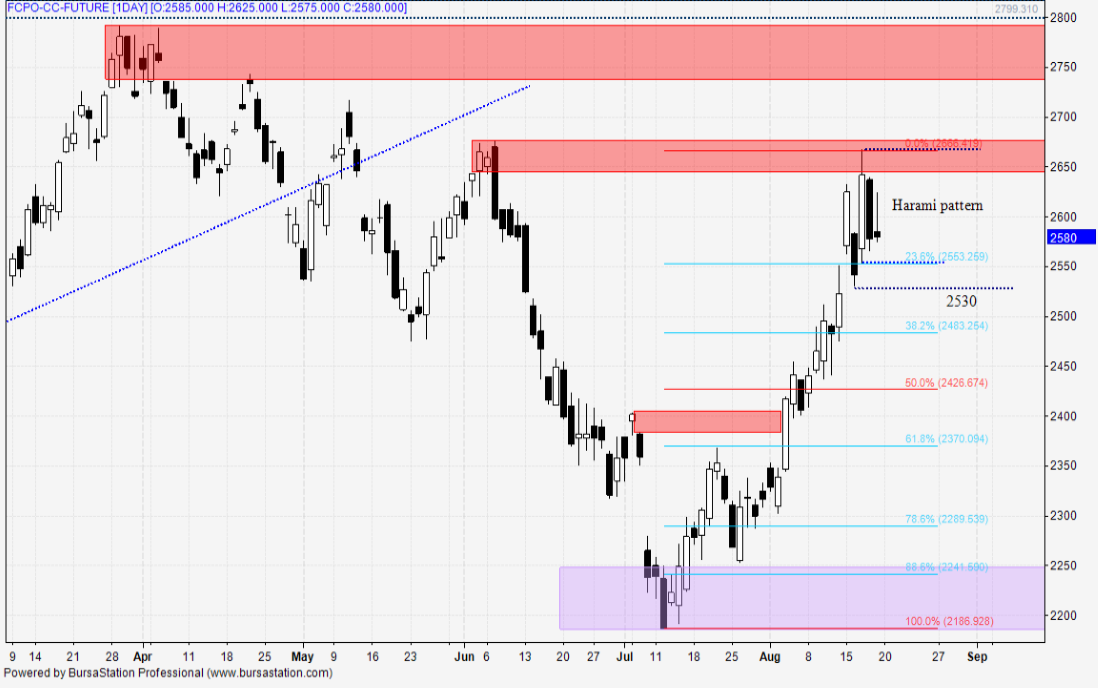

Daily Chart

Weekly Chart

Below is the trade table for year 2016 (updated up to August 2016). Purely Daily chart only. I trade tf30 chart and tf daily chart (separate account).


Saturday, August 13, 2016

Assalamualaikum & Good day to all.

Weekly time frame

Daily time frame

Looking back last week - 8-12th August 2016, Price managed to break LH of 2404 thus, confirming the uptrend. Quite pretty easy for those who are in Bull camp to score points after points right?

Lets have a look on the analysis for next week trading.
1. We have end of contract day on 15th. for active contract (3rd month contract).
2, Difference price of Oct contract and Nov contract is 30pts.
3. All indicators right now showing Buying signal.
4. Price might test 2577 this week and turns back to support area (who knows hehe)
5. Candlestick - all from Weekly & Daily is showing solid Bullish.
6. Trendline - Testing for 4 times this week. Next week potentially, it will break and need some healthy testing, before resume uptrend.

Ok. that is what I observed from the chart. What about you? Feel free to comment.

Next year, I'll open the slot for 10 students to learn & trade together using my approach to the trade - not gluing in front of laptop. 

Yup. only for 10 person. 
12month learning period, 
trading together (alert via whatsapp/telegram), 
learning fee become trading capital. Is that satisfy your need?


Sunday, August 7, 2016


Sorry for not updating here regularly. With the new technology of Telegram, I frequently update the trade progress there with my trading partners (my students). 
Nevertheless, here you are. Latest update on FCPO market

Daily Chart FCPO
  1. Market Structure - Daily. Breaks last LH. (Bull bias)
  2. Resistance 2404 become support now.
  3. Potential pullback before resume trending up?
  4. EMA trendline sloping up (bull bias)

Weekly Chart
  1. Structure - still Bearish with potential pullback to fibo area 61%
  2. Candlestick - Bullish- remain bullish until bearish candlestick engulf the whole scenario for us to reverse.
  3. Next resistance area (immediate) at 2470-2490

Happy trading. Happy hunting. Good Luck.


Ma


Blogger Template By LawnyDesignz