Monday, January 28, 2013

Hi all,

With Public Holiday on Monday (28/1) and Friday(1/2) – the volume will be on lower side (I think)….so the market will either go sideway…or continue to move up (current trend)??


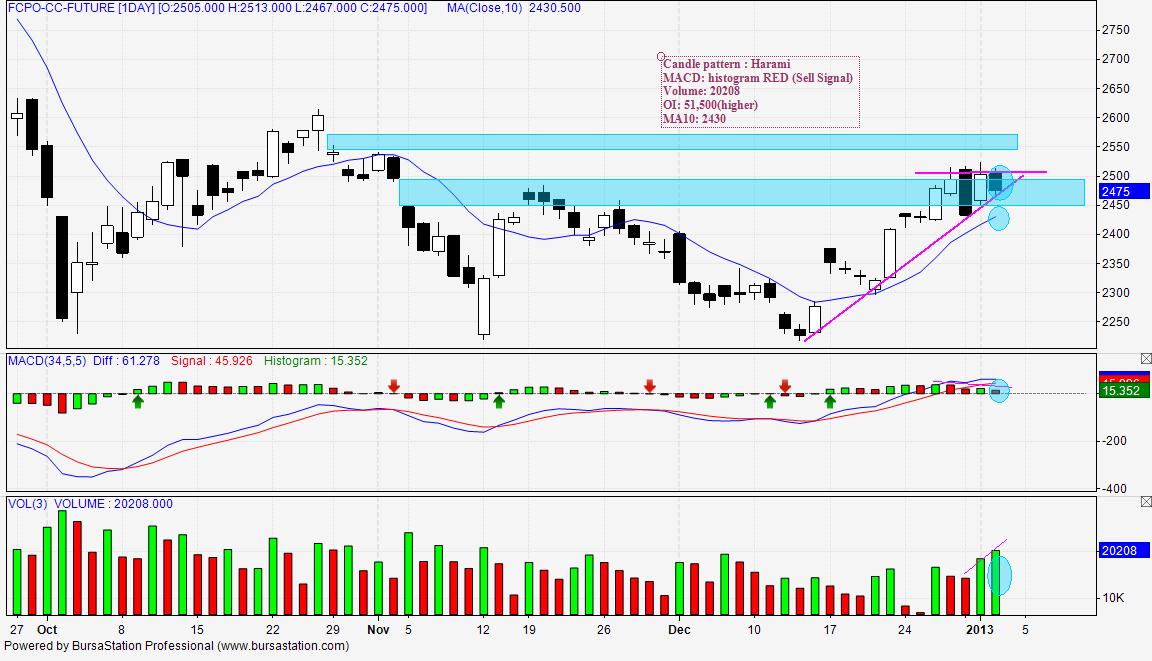
Harami candle (weekly) had been penetrated to the upside. Trendline was also break last week. Can the BULLISH momentum sustain? We shall see this week.

Immediate support  at 2380,2400...
Immediate Resistance at 2480, 2500.

My profit target this week - 30-40 pts only....

Sunday, January 20, 2013

Hi all,
Here is my analysis for FCPO next week.
Candlestick show HARAMI pattern. As it is still below downtrend line, I'll more favor to SELL bias.
Pivot point stand at 2399.
Happy trading to all.

See also, in this post - Past week analysis using MACD and trendline. Using this 2 basic tool, you will also able to catch a good trade and minimize the losses.

Fundamentally,
Over past week, the data (news) shows that export declined by 20% (that is 1/5 man!), stock still high.
Tomorrow there will be another data for export coming out (1-20 export data).

My read : When the export data keep worsening, it will become like a spring....going up after a heavy pushing to down.


Saturday, January 12, 2013

Hi all,
these are my analysis for Oil and Gold.
We will only act once the confirmation candle appeared.
At the moment -
GOLD - Engulfing Bear candle.; Bullish Divergence in development.
OIL - Pin Bar at resistance ; Wedges pattern under development.


Hi all,
as per previous post, CPO has gone lower and lower again.
With news that come out i.e export 1-10 Jan down by 25%; and the stockpile is still at high, I think the price shall test 2200 again (maybe). Just trade what you see on the chart. The news reflect into the price. People act accordingly and it shows in the chart.

So, open your mind for any possibilities ok....
Happy trading to all. Trade at your own risk


Sunday, January 6, 2013

OK,
This is combo chart, Gold, Oil and Soy Oil.
Gold - showing hammer
Oil - Showing evening star?
Soy Oil - No significant candle.... but the pattern is building momentum to continue UP!(invalid if break RBS line)


Hi all,
As the first week of 2013 ends, the tweezer type of candle has emerged. In my humble opinion, We might facing another Bear Market if price can penetrate 2433 (lowest point last week).

Pivot Point now sitting at 2474.
If I can ride the trend, then I'll less trade. Otherwise, I'll be looking for 5-10pts per day. 10pts x 5 days = 50pts.

Happy trading to all. Trade at your own risk. This is not an advisory to BUY/SELL. Its just my thought that translated into wording, in my own blog.


Friday, January 4, 2013

Hi all,
I post here my analysis for trading idea on Friday 4/1/2013. I saw Harami pattern, Engulfing pattern at Resistance.

Buy momentum may kick in back if price can close above 2520. Otherwise....the south journey continue?
Happy trading. Trade at your own risk.


Blogger Template By LawnyDesignz