Wednesday, September 30, 2009

Signal no.21

BUY signal
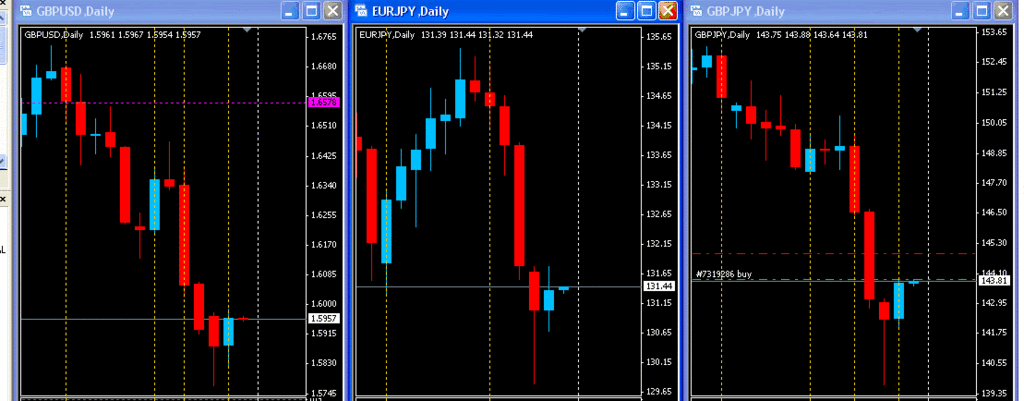
GU
GY


TAYOR. happy trading to all
temporary retracement maybe......
doadoadoa

result:
GU = +96 pips
GY = + 35 pips
all hit trailing SL
menari

Saturday, September 26, 2009

GBPJPY

GBPUSD

GOLD

GBPCHF

Another sample of trade taken.
the key point is - wait for it to come to you and be patient!
please apologize me for not putting the signal here today.
I forgot to put it here
setan

Wednesday, September 16, 2009

Total Signal = 3
GU =123 + 105 = +228 pips
GY = +138 + 148 = +286 pips
Gold = +4020 - 1050 = + 4020 pips
Grand total = +2970 pips

I would like to take this opportunity to wish you Selamat Hari Raya Aidilfitri, Maaf Zahir dan Batin.
Salam ceria untuk semua
Salam to all,
last week i've drawn the chart for readers, and now is the bigger picture.
Hopefully u manage to catch the word i wrote last week

G/U

GY

Lets ride the market. All have been move to Breakeven.
peacemenari

Saturday, September 12, 2009

Salam to all,
while waiting for Iftar today, I scale down the chart and look into bigger picture. What is the market doing now, predicting where they re heading etc.
The GBP/JPY -
looks like the M pattern (head n shoulder in progress???) - heading south. I don't know. I'll trade when my reading and indicator is in line.


GBP/JPY Daily

GBP/USD - is in range of 1.7000-1.6000


GBP/USD Daily
This is just what i saw today. We never know what will happen next. Trade what you see, not what other people thought. Happy trading to all
siulencemmenari

Thursday, September 10, 2009

Alhamdulillah,
at last, I manage to settle down myself fast and in very relax way, to trade the daily tf chart after coming back from Egypt.

It is a very simple and smart trading.As long as you belief in yourself.Further,market is showing me signal to Buy(previously). So i just do what other trader in the world doing.

Don't worry guys, one day, I'll expose it - face to face only.

Lets make friend all over the world.Peace, no war.

Monday, September 7, 2009

I would like to maintain BUY signal ;
GBP/USD
GBP/JPY
Gold - still in trade
EURO/USD
EURO/JPY

happy trading to all.Trade at your own risk
doapeace
--------------------------------------------
update:
Result
GU = +3 pips
GY = +3 pips
Gold = +1600 pips (lock at +800)

Total this month
GU = +120 + 3 = +123 pips
GY = +135 + 3 = +138 pips
Gold = +2300+1720 = + 4020 pips
Grand total = +4281 pips

Total signal Sept = 2

Friday, September 4, 2009

Copy from Metaquotes.com

Moving Average Convergence/Divergence is the next trend-following dynamic indicator. It indicates the correlation between two price moving averages.

The Moving Average Convergence/Divergence Technical Indicator is the difference between a 26-period and 12-period Exponential Moving Average (EMA). In order to clearly show buy/sell opportunities, a so-called signal line (9-period indicators` moving average) is plotted on the MACD chart.

The MACD proves most effective in wide-swinging trading markets. There are three popular ways to use the Moving Average Convergence/Divergence: crossovers, overbought/oversold conditions, and divergences.

Crossovers

The basic MACD trading rule is to sell when the MACD falls below its signal line. Similarly, a buy signal occurs when the Moving Average Convergence/Divergence rises above its signal line. It is also popular to buy/sell when the MACD goes above/below zero.

Overbought/oversold conditions

The MACD is also useful as an overbought/oversold indicator. When the shorter moving average pulls away dramatically from the longer moving average (i.e., the MACD rises), it is likely that the security price is overextending and will soon return to more realistic levels.

Divergence

An indication that an end to the current trend may be near occurs when the MACD diverges from the security. A bullish divergence occurs when the Moving Average Convergence/Divergence indicator is making new highs while prices fail to reach new highs. A bearish divergence occurs when the MACD is making new lows while prices fail to reach new lows. Both of these divergences are most significant when they occur at relatively overbought/oversold levels.


Moving Average Convergence/Divergence and Moving Average of Oscillator Technical Indicators - MACD and OsMA

Calculation of MACD

The MACD is calculated by subtracting the value of a 26-period exponential moving average from a 12-period exponential moving average. A 9-period dotted simple moving average of the MACD (the signal line) is then plotted on top of the MACD.

MACD = EMA(CLOSE, 12)-EMA(CLOSE, 26)
SIGNAL = SMA(MACD, 9)

Where:
EMA — the Exponential Moving Average;
SMA — the Simple Moving Average;
SIGNAL — the signal line of the indicator.

love

Thursday, September 3, 2009

For Tomorrow;
if the price remain high than opening today & close high, it's a BUY signal for
GY,GU

i already take BUY on Gold. so far so good - banking in +2300 pips
happy trading to all.
doa

Tuesday, September 1, 2009

I didn't trade in July & August 2009 - because i was onboard Normand Cutter during that time fullfill my obligation as underwater engineer a.k.a project engineer onboard.

Looking back at the Forex chart, and i found this for July & August 2009
GBP/USD - 8 trading opportunity - 6win, 2 loss
GBP/JPY - 10 trading opportunity - 7 win, 3 loss
Gold - heirwire...+/- 5 trading opportunity.

It's a good month for those who have guts to make it a call whether it is Buy or Sellsiul
Hope all of you doing well during those month.

I hope that the market will be on our side during this September - December 2009. Just Follow where they want to go. Make sure to check with your own analysis before making any decision.
senyumkenyit


Blogger Template By LawnyDesignz