Showing posts with label trade fcpo. Show all posts

Saturday, January 23, 2016


Picture #1 is TF Daily of FCPO.

1st signal of 2016 appeared at 2467 (Mac Contract)
The position was cleared at 2411 at the end of trading session 15/1/2016

No new position taken since that (using daily chart).
Latest EOD of 22/1/2016, The chart shows some interesting setup that is inverted head and shoulder pattern on tf30 chart.

On bigger picture, it does show Inside Bar pattern with the candle closing above midpoint of mother candle + moving average shows positive slope. Volume traded also increased.

The guess is on upper side for now. Trade the trend until it bends.


Sunday, February 16, 2014

Hi all,
lets look into Weekly Chart first.

Seem the resistance at 2692 will be tested again. but when?

Going down onto Daily Chart.....seem we got the answer there.
The chart shows 'star' sign - a bearish sign.
Potentially, market will go easy this week (my guess only).

Might be Buy on dip or buy once confirm break 2692.....

Happy trading to all.

Saturday, February 8, 2014


Potential to develop into Crab pattern.
Others - Trendline breakout; price above MA13.

CPO is in consolidation mode lately. For trend following traders like me -  suffer waiting for the setup.
but never mind. I use daily chart, so only once a day. spent couple of minutes to analyse and decide whether there is setup or not for me to take.

Happy trading all.

Saturday, January 25, 2014

Hi all,
It seem that I'm very unproductive in posting in this blog lately. Not because I'm lazy, but I just didn't know what to post here if there is no entry or signal from my eyes.

Ok, lets see the FCPO market ending 24/1/2014.
The pattern that I see know-
1. Candlestick - Inside Bar
2. MACD - showing positiveness.
3. Trend - Sideways within short term downtrend channel. on bigger channel, we're still in uptrend channel.

I'm more towards BUY or LONG by looking into the chart. What about you ?
Happy trading. Trade on your own risk (TAYOR).

I'm using 4hr chart and Daily chart as my trigger entry. I'm happy if I can get 20-50 trades per year with 70-80% success. It becomes my 2nd income, to add into my day to day job salary as Engineer in Oil & Gas. No need to rush, no need to monitor the market whole day. What I need is a few minutes a day to analyse the market at night or early morning and decide whether there is setup for me, where is the entry points, where is my stop loss point.


Tuesday, December 10, 2013

Counting for fun.
Trading as simple as possible.
Counting EW is not easy as 12345 and abc......

Chart pattern wise, Triangle pattern breakout and first re-test of trendline breakout. Potential Buy on dip?
Who knows kan....trade on your own risk and effort.

I'm bias to BUY camp on December.

Monday, November 25, 2013


FCPO Outlook;
There are 2 possibilities that came into my mind right now.

1. This is wave 1 of 5 of (5) (Final point in mind is 28xx). Sharp correction i.e zig zag coming to 61.8% + testing RBS point 2601 for the first time before resuming up.

2. This is the final wave i.e wave 5. Correction shall be more severe to down. Current wave shall be wave A. B up to 61.8% and C shall be 5 wave down to previous ending of wave 4.

Lets the market unfold itself.

Without EW, I prefer to use simple SnR break style trading with 1-2 indicator as confirmation. Currently -  all are saying keep on BUY position.

FKLI Outlook;
From EW perspective - FKLI shall continue its down movement to complete final correction wave abc (maybe limited to support line as showing).
From there on, there will be a big bull coming to 2014 (maybe.....who knows exactly isn't it?) - So, I decided to hold on all of my shares in company that I invest for further some more time.
It's all about timing right.......

Thursday, November 7, 2013

From EW perspective....I m still learning
EW is all about pattern formation.
cheers.

I didnt trade on tf 30,
I trade mainly on tf 4hour or Daily. Yup, I'm talking about trading overnight (bring the trade to the next next day).

I just playing and trying to count on tf 30.
My EW count is not good. People used to call it SESATTTTTT.....

Friday, November 1, 2013


Completion of 5 wave + ending diagonal?
On Weekly, the price surged past neckline for inverted head and shoulder (weekly & daily chart). Potentially, it will reverse to test the neckline (1 time) before resume it original move that is uptrend.

Congratulation to all winners.
Try to identify impulse move that is wave 1,3,5, A & C........patient needed. 
p/s - I still trigger the trade based on my trading strategy. Simple and no headache. Managed to catch the impulse wave. 

I think I'll conduct the coaching session only when I managed to gain multi-million in this futures trading business. Right now......stay silent in blog is better.

Saturday, October 19, 2013

I see the harmonic pattern probable setup on FCPO.
and I'm still learning to count EW correctly. yup. Still struggling.
For me, those 2 are forecasting technique. I'll still trigger a trade based on my preferred trading plan.


from Q & A with elliotician, we are in the wave of 12345.....not ABC; Primary trend is wave 4 (flat pattern 3-3-5)
Ok thats all.

Till then, happy trading

UPDATE 25/10/2013
It hit my target on upper side and blow away....
Will it happen like what i draw (shark pattern) previously? Let see....
Harmonic Pattern and EW (Forecasting Method); Triggering - my own method.


Wednesday, August 21, 2013

At the moment, seem the price respect 2285 support line very well.
on 60minutes chart, price seen break the trendline and testing it for the 1st time(with very long bull candle).
Let's see what will happen today.


Thursday, August 1, 2013

Hi All,
1) Double Bottom - 2137
2) Pop up Candle (Engulfing type)
3) Trendline breaks
4) Above MA line.

This suggest the Bull is coming back. Buy on retracement to fibo line 50-61.8% line. TAYOR!


Saturday, July 20, 2013

Hi guys,
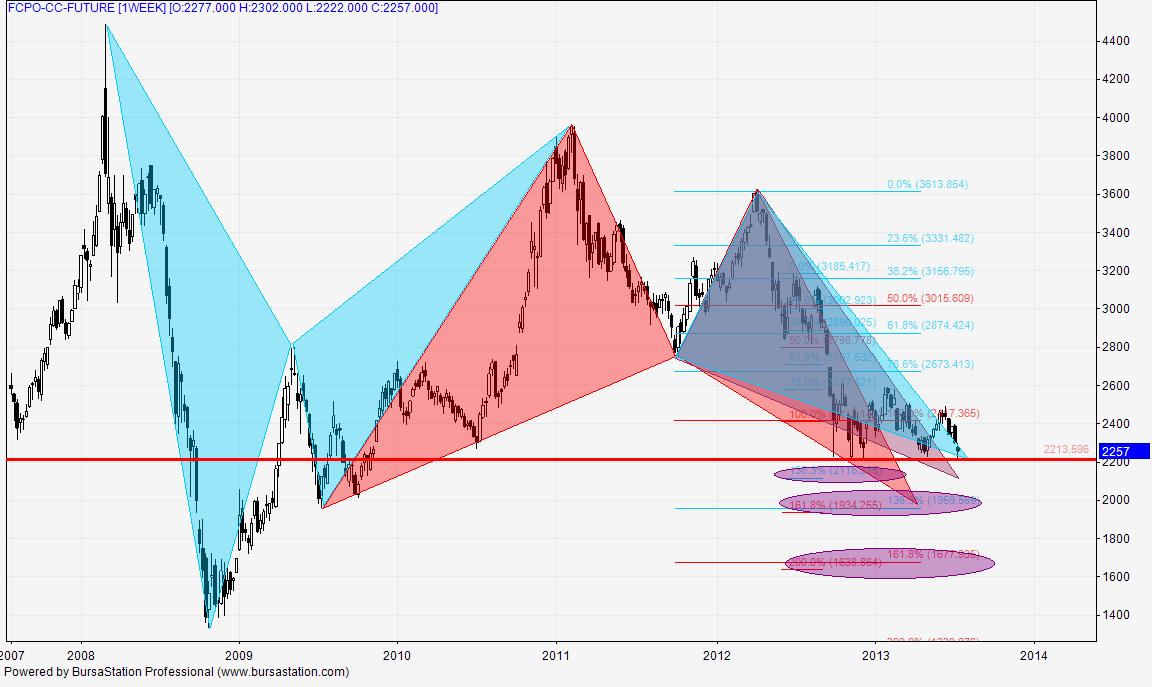
Lets take a look, from Harmonic Pattern Perspective.
on weekly basis -
Potential for Butterfly / Gartley. Target area in the circle before bounce back to become BULL.
However, we need to see the price break the supper support 2220 and close below it first.

We must remember, that when trading in commodities, the price shall not stay at super low for too long or super high for too long due to production cost etc. everything have to be counted.

Trade with cautious. Act fast with fast changing game like this. At the moment, FCPO is not so favourable to Daily tf trader. Me too. I diverted to tf 4hr for better opportunity.

Saturday, July 13, 2013


Hi,
OK....last friday, big move down from Thursday. about 72 points. Hopefully, you manage to catch it (if not all).

My reading was failed. The price didn't even touch 50% retracement of fibo before resume downtrend. So, i cut my trade earlier (nasib baik je nih), and manage to catch the down move.

Trading Idea:-
1. Above MA8 on Daily Chart - BUY bias. Turn to H1 Chart, trade buy as long as price above MA8 on H1 chart. Out when it moves to other side. As long as Daily Chart price still above MA8, only find signal for BUY on H1 chart.

2. Below MA8 on Daily Chart - SELL bias. Turn to H1 Chart, trade Sell as long as price below MA8 on H1 chart. Out when it moves to other side.As long as Daily Chart price still below MA8, only find signal for SELL on H1 chart.

Sunday, March 3, 2013

Hi all,
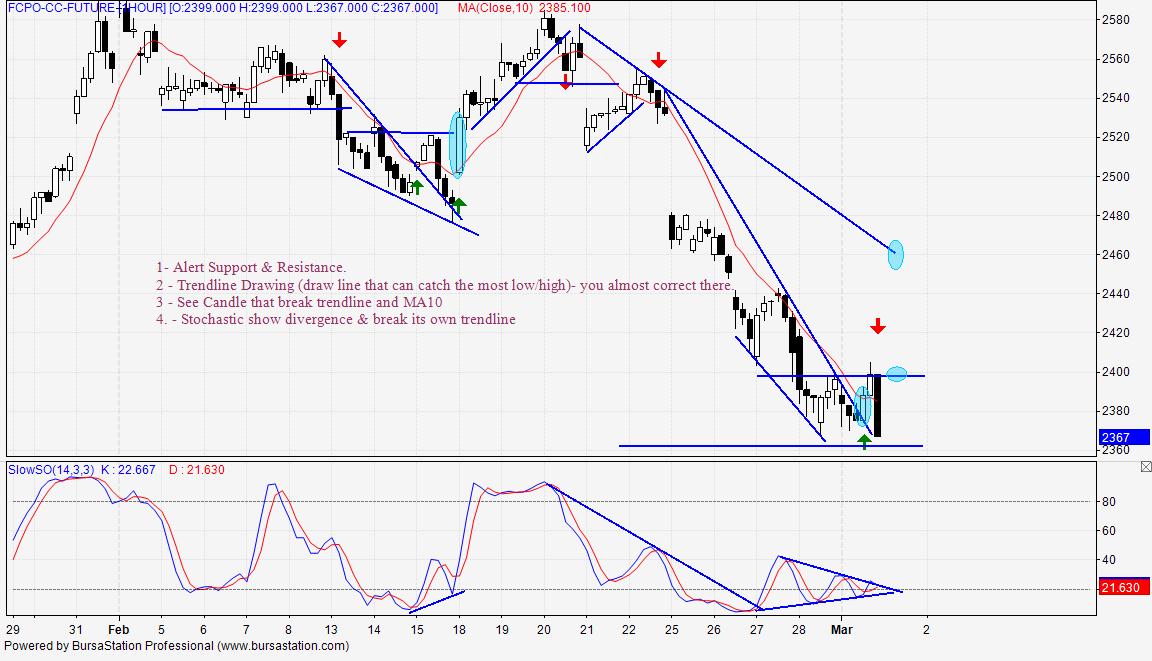
For the whole week, we saw a big gap and drop of CPO price from 2530 to 2367 (end of week).
This week, we might see some correction in price. Rebound from Soy oil also will support the correction. We might see the gap up in Monday.

My opinion, if I want to BUY, I'll buy and take profit fast i.e 10-15 pts. I'll try to SELL on Rally.
Trade what you see guys.
TAYOR.

P/s - You need to decide and timing your action to take position in trading accordingly.

weekly chart

hourly chart


Sunday, February 24, 2013

Hi all, lets look at the Daily and Weekly Candle of FCPO (May 13 Contract).
My Analysis - SELL Bias.
reason?
1. Weekly candle end in Bull candle. However, the long shadow on upper part really made me concern
2. Friday candle (Daily) is a pin bar type of candle appeared at Resistance area.
3. Price is at MA10 (maybe going down).

I might be wrong. Take action accordingly.
Trade what you see, not what you hear ya!


Sunday, February 17, 2013

Hi all,
as usual, let see the FCPO market (Weekly and Daily Chart)

Weekly - Bearish Candle
Daily - 3 Soldiers.

Pivot Point - 2493.
My bias shall be SELL, since the major trendline on weekly is still strong holding at the top.. Estimation to go down until 161.8% Fibo projection.

Trade what you see eh, not what you hear.


Monday, February 4, 2013

Hi all,
With the 3 Soldiers appeared on Weekly Chart, We might have BUY momentum prolong until CNY at least (maybe.....)

So, My strategy will be BUY on DIP - need to find good entry on 1hr or M30 chart.
Happy trading to all.

Target - 2644 and 2717....


Monday, January 28, 2013

Hi all,

With Public Holiday on Monday (28/1) and Friday(1/2) – the volume will be on lower side (I think)….so the market will either go sideway…or continue to move up (current trend)??


Harami candle (weekly) had been penetrated to the upside. Trendline was also break last week. Can the BULLISH momentum sustain? We shall see this week.

Immediate support  at 2380,2400...
Immediate Resistance at 2480, 2500.

My profit target this week - 30-40 pts only....

Sunday, January 20, 2013

Hi all,
Here is my analysis for FCPO next week.
Candlestick show HARAMI pattern. As it is still below downtrend line, I'll more favor to SELL bias.
Pivot point stand at 2399.
Happy trading to all.

See also, in this post - Past week analysis using MACD and trendline. Using this 2 basic tool, you will also able to catch a good trade and minimize the losses.

Fundamentally,
Over past week, the data (news) shows that export declined by 20% (that is 1/5 man!), stock still high.
Tomorrow there will be another data for export coming out (1-20 export data).

My read : When the export data keep worsening, it will become like a spring....going up after a heavy pushing to down.


Saturday, January 12, 2013

Hi all,
as per previous post, CPO has gone lower and lower again.
With news that come out i.e export 1-10 Jan down by 25%; and the stockpile is still at high, I think the price shall test 2200 again (maybe). Just trade what you see on the chart. The news reflect into the price. People act accordingly and it shows in the chart.

So, open your mind for any possibilities ok....
Happy trading to all. Trade at your own risk


Blogger Template By LawnyDesignz