Showing posts with label forex learning. Show all posts

Monday, October 2, 2017

Salam,

Bulan September telah melabuhkan tirainya. Bagaimana dengan trading tuan tuan. Semoga sentiasa disiplin dengan trading plan (business plan) anda hendaknya.

Untuk meraih keuntungan, sikit ataupun banyak, petuanya....
1. Ada trading plan yang mudah untuk anda ikuti.
2. Disiplin diri untuk trade mengikut trading plan.
3. Tawakkal.Berserah diri sepenuhnya pada yg Maha Memberi Rezeki.

Bulan September ni, Alhamdulillah....team kami sekali lagi mencatatkan keputusan memberangsangkan...berjaya meraih keuntungan yang boleh kata agak hensem untuk geng geng part time. >100pts.

OK, jom tengok graf CPO kita......
Dijangkakan.....2684 akan dipecahkan minggu ni, dan CPO akan semakin menggolek. Namun, harus diingat....harga semasa sedang berada di kawasan support yang boleh kata kuat.

Kita akan bertindak mengikut setup yang keluar dan jangan ragu ragu. Entry dah kena, sila la letak hard Stop Loss, dan target.

Chart pattern wise - Potential Head and Shoulder in the making.

Bismillah.


Sunday, February 17, 2013

This is Ichimoku Kinko Hyo sample....on EurJpy.
Sell sign as the price is moving below the cloud...

This indicator is a trend tracker type...so once you catch the move, let it be like that...100 over pips....


Friday, October 29, 2010

Hi traders,
first, please apologize me for not updating this blog for soooo long time. I didnt have access to the blogspot at offshore.

OK, here are the summary of last week trading opportunity on 4hr timeframe. Easy to find but we have to wait for it to appear( at suitable Support and Resistance area).

How to trade the Harami? answer - Trade the breakout.
Where is the TP & SL - it is up to you. You have to define yourself how much do you want to risk your account.


Sunday, August 15, 2010

Ok guys,
lets recap / study back last week price action....
Lets see how many signal we can capture from this single price action.
(HARAMI)


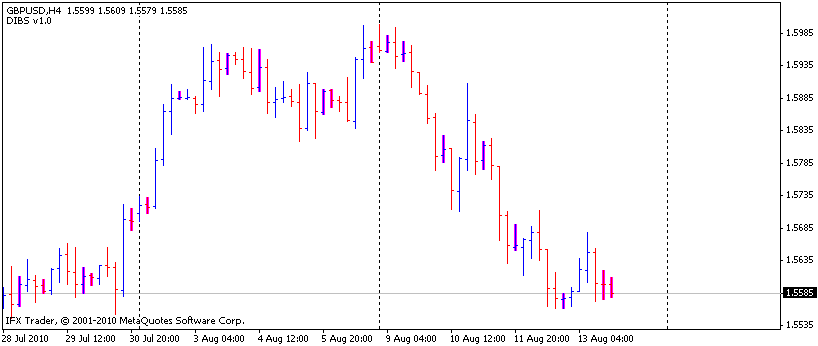
GY - 6 Harami in 1 week period

GU - 7 Harami in 1 week period

EY- 8 Harami in 1 week period

Instead waiting at daily time frame (as what i'm doing right now), we can wait & take the opportunity at 4hr time frame.

What you need to know are:
1. Where is the SnR
2. How to take advantage on Price Action & know where is your entry/exit point....
3. Know your own target of pips / RM.

Till then, Happy trading to everybody....


Sunday, August 1, 2010

I like this articel posted in www.fxextract.com
Well said, well written - but in reality, trust me..hard to apply;but not impossible. Discipline needed. Enjoy your reading


This is all about making a fortune with Forex. Most traders just go with the flow and make average gains, with this article you will learn what makes some traders stand out and a lot richer than others!

We are going to assume that you know how to trade, and has quite an experience in trading.With simple changes in your trade selection, money and risk management, and mindset, you can change that average gains into larger ones!

Fast money is in Forex, it is a lifestyle. here is it how its done.

Tip 1.
Embrace Changeability and Risk With a Smile Forex systems have instability.
If you cannot manage and calculate your risk, then don't ever think about trading in Forex. Many traders back away from forex because of this ( why do you even traded in the first place?). But taking manageable risks has its rewards.
It's just simple, you know what your losing if ever it doesn't work out, yet what you gain is unpredictable but sure is high! That is what I call excitement, my friend.To a well-educated Forex trader, this is something you shouldn't be afraid of, might as well embrace it.

Tip 2. Trade Less, gain more
Most traders think that if they don't trade, another door has closed, or miss some move. The tendency, they trade frequently. Most of the trades that come big come a few times in a year. Focus on the trades that make the really big gains. Be alert, and informed.

Tip 3. Diversify is a no-no
Most Investors accept the fact that diversification can make money fast - in reality it does exactly the opposite.


Tip 4. Money and Risk Management
This article has been concentrating on the Big gains, because this is your money, so every penny should be controlled, this is where money management kicks in.Control your risks, but increase your chances of success:
- Give yourself staying power by buying options at or in the money, this prevents you from getting stopped out. Many traders lose not by the market direction, but because they were stopped out by a instable move, and options will give you staying power.
- Keep your stop in its original position - until the move is well in profit, before moving it up.
- Trading fast and selectively - have the courage to trade when you feel it is good. and enjoy the cash.

Tip 5. Compound growth has its benefits
The way to make money fast in forex, is to understand the power of compound growth. For example, if you target 50% a year in your trading, you can grow an initial $20,000 account, to over a million dollars, in under 10 years.

Break the norm, and gain more. Follow some of these tips and make your way into the big gains!

Tuesday, July 13, 2010

Ok, Lets learn the most basic thing about candlestick.

Lesson no.1 -
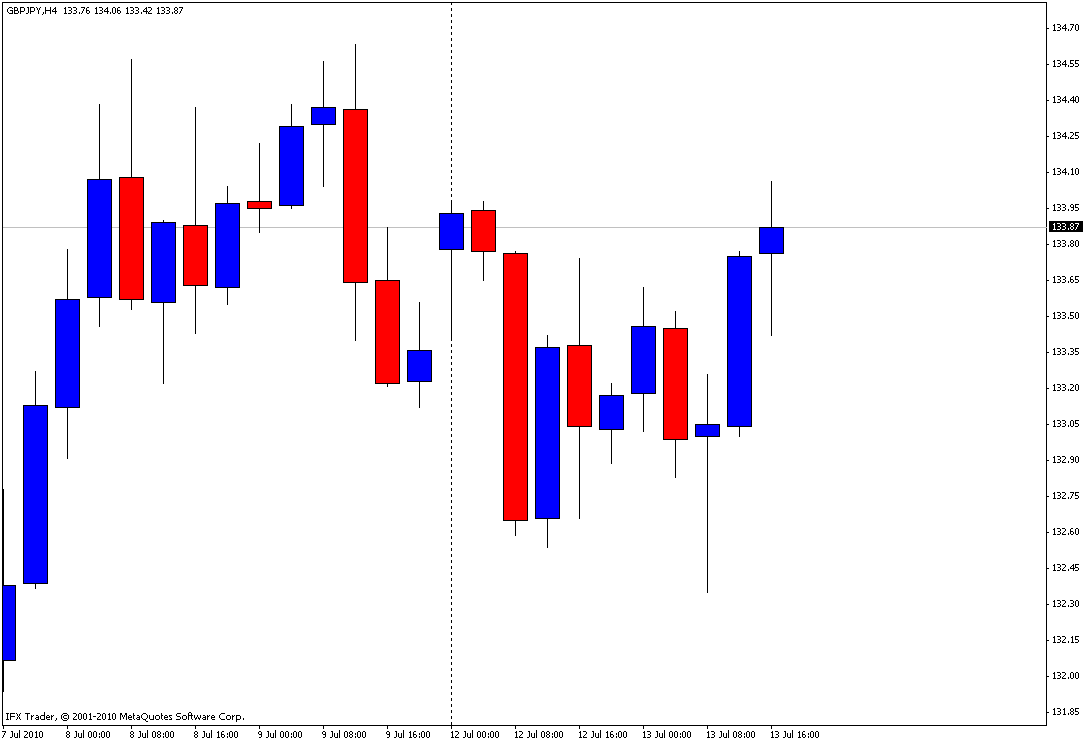
Candlestick shows us the high, low, open and closing price in graphical mode. It was introduced to the world by the Japanese traders but elaborate deeply by Steve Nison- who also known as a candlestick pioneer. (ye ke??)

Lesson no.2 -
To differentiate it, we put color into candlestick ie - Red for candlestick which have closing price lower than opening price and Blue for candlestick with closing higher than opening price.

To be continue to Candlestick Basic no.2

Tuesday, January 19, 2010

Announcement:
Sharing session (learning basket trading system- as per in the forum thread)
Date: 21/1/2010
Time : 9pm-12pm
Venue: Ani Sup Utara, Damansara Damai.
Please bring your own laptop & broadband. We may meet at Ani and then move to McD for free internet.

We share what we know that night (on Basket trading). I also in the midst of understanding the concept behind it.

Monday, October 26, 2009

Sorry guys,
I didnt update the thread this morning,
just came back from Kedah....visiting my family in law + my kids there (my wife berpantang there)

OK...straight to the point;
GU - Sell
GY - Sell
Gold - Sell - i got stopped +500 pips last week and now re-enter Short. in +ve side...

We will see what happen to our trades later....May the rezk with us. Insya Allah.
doa

will show u the chart later ok....cya...

Wednesday, September 16, 2009

Salam to all,
last week i've drawn the chart for readers, and now is the bigger picture.
Hopefully u manage to catch the word i wrote last week

G/U

GY

Lets ride the market. All have been move to Breakeven.
peacemenari

Saturday, September 12, 2009

Salam to all,
while waiting for Iftar today, I scale down the chart and look into bigger picture. What is the market doing now, predicting where they re heading etc.
The GBP/JPY -
looks like the M pattern (head n shoulder in progress???) - heading south. I don't know. I'll trade when my reading and indicator is in line.


GBP/JPY Daily

GBP/USD - is in range of 1.7000-1.6000


GBP/USD Daily
This is just what i saw today. We never know what will happen next. Trade what you see, not what other people thought. Happy trading to all
siulencemmenari

Friday, September 4, 2009

Copy from Metaquotes.com

Moving Average Convergence/Divergence is the next trend-following dynamic indicator. It indicates the correlation between two price moving averages.

The Moving Average Convergence/Divergence Technical Indicator is the difference between a 26-period and 12-period Exponential Moving Average (EMA). In order to clearly show buy/sell opportunities, a so-called signal line (9-period indicators` moving average) is plotted on the MACD chart.

The MACD proves most effective in wide-swinging trading markets. There are three popular ways to use the Moving Average Convergence/Divergence: crossovers, overbought/oversold conditions, and divergences.

Crossovers

The basic MACD trading rule is to sell when the MACD falls below its signal line. Similarly, a buy signal occurs when the Moving Average Convergence/Divergence rises above its signal line. It is also popular to buy/sell when the MACD goes above/below zero.

Overbought/oversold conditions

The MACD is also useful as an overbought/oversold indicator. When the shorter moving average pulls away dramatically from the longer moving average (i.e., the MACD rises), it is likely that the security price is overextending and will soon return to more realistic levels.

Divergence

An indication that an end to the current trend may be near occurs when the MACD diverges from the security. A bullish divergence occurs when the Moving Average Convergence/Divergence indicator is making new highs while prices fail to reach new highs. A bearish divergence occurs when the MACD is making new lows while prices fail to reach new lows. Both of these divergences are most significant when they occur at relatively overbought/oversold levels.


Moving Average Convergence/Divergence and Moving Average of Oscillator Technical Indicators - MACD and OsMA

Calculation of MACD

The MACD is calculated by subtracting the value of a 26-period exponential moving average from a 12-period exponential moving average. A 9-period dotted simple moving average of the MACD (the signal line) is then plotted on top of the MACD.

MACD = EMA(CLOSE, 12)-EMA(CLOSE, 26)
SIGNAL = SMA(MACD, 9)

Where:
EMA — the Exponential Moving Average;
SMA — the Simple Moving Average;
SIGNAL — the signal line of the indicator.


love


Blogger Template By LawnyDesignz