Sunday, February 21, 2016


Lets see where the FCPO price will be heading this week (22-26 Feb 2016)
From my analysis, the probability is to pullback to the previously resistance that has become support.
Please do your own analysis before taking any position.


Tuesday, February 16, 2016

Assalamualaikum and Good Day everybody.

1. 15.2.2016 - Last day for April Contract FCPO. Next active contract month is May.
2. ITS reported that export for 1-15 Feb 2016 was down by (16.11%) compared to 1-15 Jan 2016.
3. SGS reported that export for 1-15 Feb 2016 was down (14.16%)

OK. Finisih with fundamental. Lets look to the chart. What does it trying to tell us.

Zooming out, my reading of inverted Head & Shoulder still intact. However, Price is stuck at current resistance and pull back to previously RBS.

When we look into smaller scale - we can see the candle shows engulfing pattern, which is sign of reversal.

OK. That's it. Let's go hunting - on your preferred time frame.

#fcpo
#learnfcpo
#tradefcpo


Monday, February 8, 2016

Let's look onto Crude Chart (zoom out chart)

I guess, it is already oversold.
But market does whatever it wants (based on majority of position)


Lets look what will happen this time.
Fundamentally, Productions are still far over from demand line, thus it will rules the price.

Harga sedap nak produce minyak untuk kebanyakan producer -  USD35/barrel. Lebih dari tu untung la.
Assalamualaikum & Hi everybody.

First - Happy Chinese New Year to all my chinese buddy.

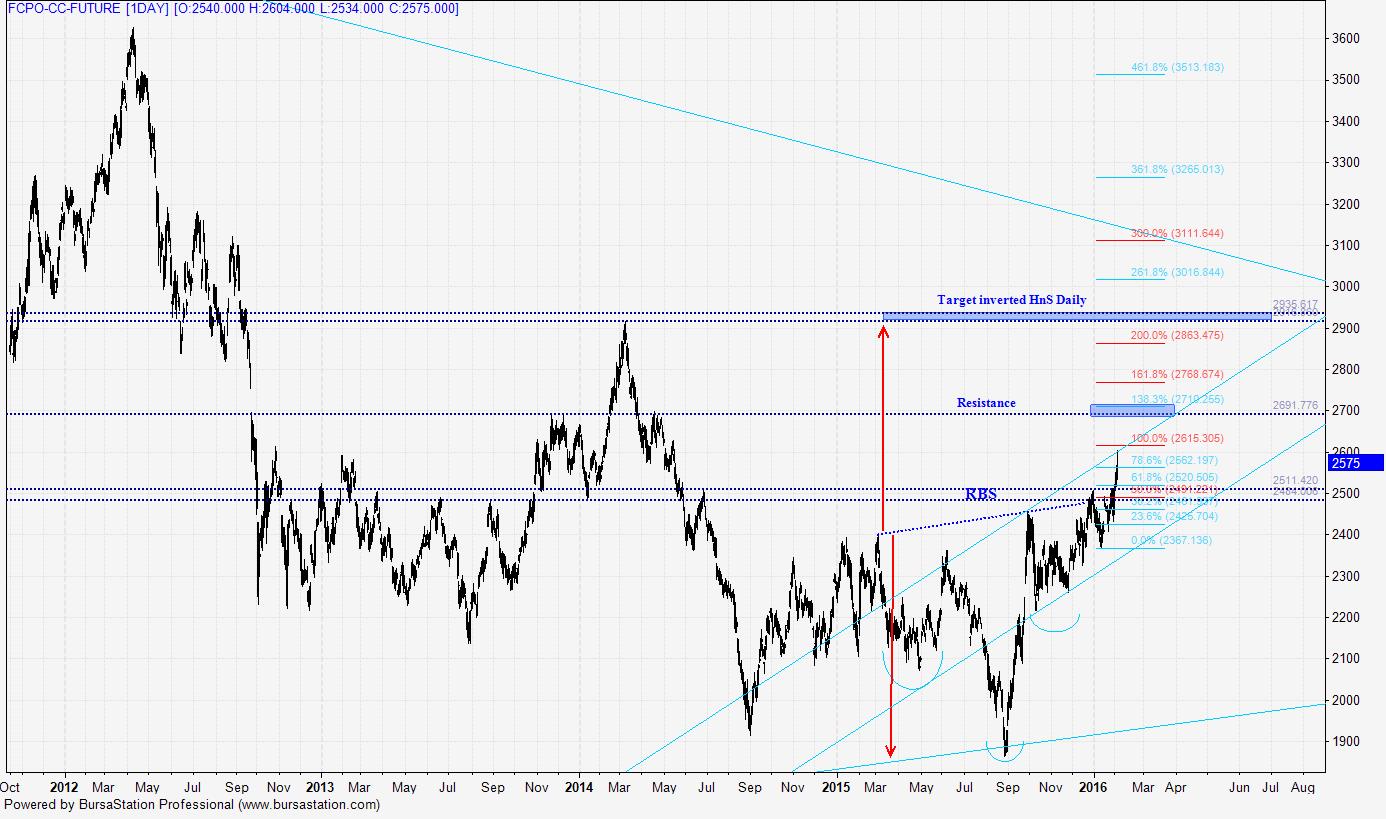
Second -  Lets take a look onto the chart - FCPO (Daily Chart). This is my analysis. Trigger point will be different. Everybody has their own opinion. So I appreciate positive comments.


On Daily chart, we saw that FCPO price already breach the Resistance and reached target of tf30m iHnS. I think, it might going to test the new Support (RBS) before  resume it uptrend.

Daily target for iHnS as in the picture. Maybe correct maybe not. Market participants decide collectively. I just follow the majority. Just try to be an early bird.

OK....now, from the zoom out daily picture above, can you spot how many HnS pattern on the chart?

I'll update from time to time if there is any changes on the chart/market


Blogger Template By LawnyDesignz